In short
Revenge trading means opening a new position right after a loss, often bigger and outside your plan, to win back the money you just lost. It shows up in your trade history: trades opened minutes after a loss, position size growing during a losing streak, losses concentrated on a few days. You stop it with rules set in advance: a daily loss limit, a mandatory break and a fixed risk.
Key takeaways
- Revenge trading is not a lack of willpower: loss aversion naturally pushes you to take more risk after a loss.
- It leaves three measurable traces in your history: a very short delay after a loss, a position size that climbs, and disaster days.
- Doubling up to win it back turns an ordinary losing streak into a drawdown that takes weeks to recover from.
- The rules that work are decided before the session: a daily loss limit, a break after 2 or 3 losses, a fixed risk per trade.
- Tagging every revenge trade in your journal lets you put a real number on what it costs you.
You just got stopped out. Two minutes later, the market moves back in your direction. You jump in again, a little bigger, without really checking your setup. Stopped out again. This time you double the size. That is exactly what revenge trading is. And most traders who do it only notice when they look at their balance in the evening.
This guide won’t tell you to “stay calm”. It shows you how to spot this behavior in your own data, what it really costs, and the concrete rules that stop it from kicking in.
What is revenge trading?
Revenge trading is taking a position to win back a loss, not because your plan gives you a signal. It has three telltale characteristics:
- Timing: the trade comes very shortly after a loss.
- Size: the position is often bigger than usual, because you want to “get it all back in one go”.
- Plan: the setup is missing or sloppy, or the stop is widened to “give it room to breathe”.
Tilt is the emotional state. Revenge trading is acting on it. You can be on tilt without trading (and that is actually the right reflex); you never revenge trade without being on tilt. Don’t confuse it with FOMO in trading, which is triggered by a move you missed rather than by a loss.
Why your brain pushes you to win it back
This is not a character flaw. It is a bias that has been documented for more than forty years.
In 1979, Daniel Kahneman and Amos Tversky published prospect theory: when facing a loss, people become risk seekers, while they are cautious when facing a gain. Their 1992 work estimates that a loss weighs roughly twice as much as a gain of the same size in our decisions. After a stop, your brain is not looking for the best decision: it is looking to erase the pain.
Professionals are not immune. Joshua Coval and Tyler Shumway studied proprietary traders at the Chicago Board of Trade (Journal of Finance, 2005). The result: those who had lost money in the morning were about 16% more likely to take above-average risk in the afternoon than those who had made money. Experienced traders, paid to be disciplined, increase their risk after a loss.
If professional traders at the CBOT do it, expect to do it too. The question is not “am I revenge trading?” but “how much does it cost me and how do I block it?”
The 3 traces revenge trading leaves in your history
Your feelings lie. Your history doesn’t. Export your history from MetaTrader 4, MetaTrader 5, cTrader or TradingView and look for these three signals.
| Signal | What you are looking for | Warning threshold (guideline) |
|---|---|---|
| Delay after a loss | Time between closing a losing trade and opening the next one | Several trades opened less than 5 to 10 minutes after a loss |
| Size escalation | Lots of trade N compared with trade N-1 during a losing streak | Size increasing by more than 50% over 3 losses in a row |
| Disaster day | Loss for the day compared with your average daily loss | One day that wipes out one or more weeks of gains |
1. The delay after a loss
Sort your trades by opening time. For each losing trade, note the time that passed before the next trade. Then compare the average result of the “fast” trades (opened right after a loss) with that of all your other trades. If the fast trades have a clearly lower win rate or average result, you have your proof.
2. Size escalation
Look at your streaks of 3 or more losses. Does your position size stay stable, or does it climb? A size that grows during a losing streak is a martingale in disguise: you bet bigger precisely when you are least clear-headed.
3. Disaster days
Calculate your average loss on a losing day. Then isolate the days that exceed two or three times that average. For many traders, a handful of days account for a large share of total losses. Those days are almost always revenge days, and often days when your number of trades exploded: a sign that revenge trading has turned into overtrading.
What it really costs: a worked example
Take a 10,000 € account with a rule of risking 1% per trade, so 100 € per trade. The trader hits 5 losing trades in a row. Here are two scenarios (illustrative example):
| Trade | Disciplined trader (fixed risk) | Revenge trader (doubles after each loss from the 3rd) |
|---|---|---|
| 1 | −100 € | −100 € |
| 2 | −100 € | −100 € |
| 3 | −100 € | −200 € |
| 4 | −100 € | −400 € |
| 5 | −100 € | −800 € |
| Total | −500 € (−5%) | −1,600 € (−16%) |
Same strategy, same signals, same losing streak: the second trader loses more than three times as much. And the problem doesn’t stop there, because recovering from a drawdown requires a proportionally bigger gain:
| Drawdown | Gain needed to get back to zero |
|---|---|
| −5% | +5.3% |
| −10% | +11.1% |
| −16% | +19% |
| −30% | +42.9% |
| −50% | +100% |
At −5%, one good week is enough. At −16%, it often takes one or several months of clean trading. And it is precisely during those weeks of catching up that the temptation to do it again is strongest.
To put these numbers in perspective: the study published by the AMF (the French financial markets authority) in 2014, covering 14,799 retail clients of Forex and CFD brokers between 2009 and 2013, shows that 89% of them lost money, with an average loss of 10,887 € per client. Revenge trading is obviously not the only cause, but it is one of the mechanisms that turn a bad week into a blown account.
5 rules to stop revenge trading
The principle is simple: rules are decided cold, and applied hot. During a session, you no longer have the clarity to weigh things up. You need rules that require no decision.
1. A daily loss limit, written down before the open
Set a maximum loss per day, for example 2 to 3 times your risk per trade. When it is reached, the session is over. No “one last trade”, no switching instruments. If your platform or prop firm lets you lock the account, use it.
2. A mandatory break after a loss
After every loss, get up from your screen. Many traders impose 15 to 30 minutes on themselves. After 2 or 3 consecutive losses, end the session. The break interrupts the “loss, frustration, new trade” loop.
3. A fixed risk, calculated before you look at the chart
Your position size is calculated from your stop and your risk percentage, never from what you need to win back. If you catch yourself calculating “how many lots to get it all back”, that is your signal to stop.
4. A non-negotiable entry checklist
Before every trade, tick off the conditions of your setup. No complete checklist, no trade. A revenge trade almost always fails at this step: that is why the checklist has to exist physically, not just in your head.
5. A “revenge” tag in your journal
Every time a trade was influenced by the previous loss, tag it. After a month, add up the results of these trades. That number, the real cost of your revenge trading, is often the most effective wake-up call: it makes visible a mistake you would never have measured otherwise.
Automate detection with a trading journal
Doing these calculations by hand in Excel is possible, but tedious, and most people give up after two weeks. That is the whole point of a trading journal that analyzes your history automatically.
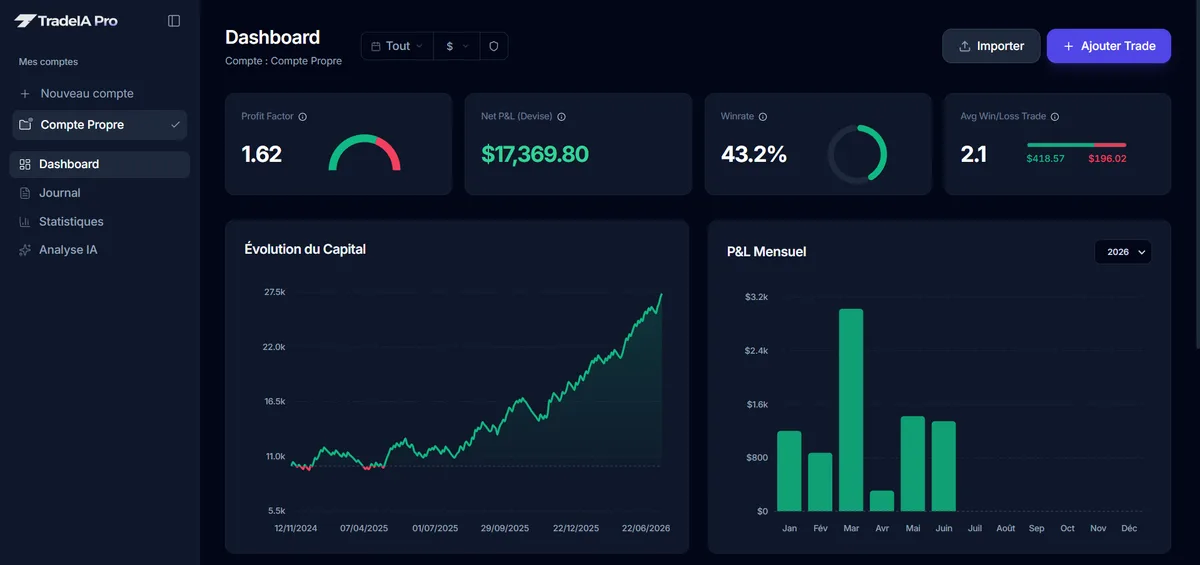
In TradeIA, you import your MT4, MT5, cTrader or TradingView history, and the analysis flags, among other things, streaks of at least three losses during which your position size increases by more than 50% from one trade to the next, as well as days when your number of trades explodes compared with your average. You see directly when it happens and how much it costs you, without a spreadsheet.
Whatever tool you use, the most important thing is still the review: once a week, look at your trades tagged as revenge and check that their number is going down.
In short
Revenge trading is a human reflex, not a personal weakness. You won’t get rid of it through willpower. You neutralize it by making it visible (the three traces in your history) and by making it impossible (rules decided before the session). Start this week with a single rule: the daily loss limit. Then measure.
Frequently asked questions
05What is revenge trading?
It is opening a new position right after a loss, driven by frustration, with the goal of quickly getting back the money you lost. The trade usually breaks your plan: no setup, bigger size, a wider stop or no stop at all.
What is the difference between revenge trading and tilt?
Tilt is the emotional state in which you no longer make rational decisions, after a loss, a losing streak or even a euphoric win. Revenge trading is one of its most common forms: the specific behavior of trying to win it all back immediately.
How long should I wait after a loss before taking another trade?
There is no validated universal duration. Many traders force themselves to spend 15 to 30 minutes away from the screen after a loss, and to stop the session completely after 2 or 3 consecutive losses. What matters is that the rule is set before the session and applied without exception.
How do I know if I am revenge trading?
Look at your history: compare the results of trades opened in the minutes after a loss with the rest of your trades, check whether your position size increases during losing streaks, and identify the days when you lost more than two or three times your average loss. If these three signals keep coming back, it is a pattern, not an accident.
Is a daily loss limit enough to stop revenge trading?
It limits the damage but is not always enough on its own, because some traders get around it by switching accounts or instruments. It works better combined with a fixed risk per trade and a weekly review of the trades tagged as revenge in your journal.
Sources
04- AMF, Study of retail investors' results in CFD and Forex trading in France (2014)
- Coval J. and Shumway T., Do Behavioral Biases Affect Prices?, The Journal of Finance (2005)
- Kahneman D. and Tversky A., Prospect Theory: An Analysis of Decision under Risk, Econometrica (1979)
- Tversky A. and Kahneman D., Advances in Prospect Theory: Cumulative Representation of Uncertainty, Journal of Risk and Uncertainty (1992)
Educational content. It does not constitute investment advice. Trading leveraged products carries a high risk of losing your capital.