In short
Drawdown is the drop in your capital between a peak and the lowest point that follows, before a new high. Maximum drawdown is the largest of these drops: (peak − trough) ÷ peak. It can be anticipated: with a 50% win rate, a run of 5 losses in a row shows up in 81% of 100-trade sequences, which is why a limited risk per trade matters.
Key takeaways
- Drawdown measures the drop in your capital between a high and the trough that follows; maximum drawdown is the largest of these drops over the period.
- A drawdown takes a bigger gain than the loss to recover: −20% requires +25%, −50% requires +100%.
- Losing streaks are normal: with a 50% win rate, 81% of 100-trade sequences contain at least 5 losses in a row.
- Your risk per trade decides how deep the drawdown goes: 8 losses in a row cost 7.7% of the account at 1% risk and 33.7% at 5%.
- Set your maximum acceptable drawdown before you trade, then derive your risk per trade from it, not the other way around.
Your account has dropped 12% in three weeks. Is that normal, or a sign your strategy has stopped working? Without a benchmark, you are left with two bad options: quit at the wrong moment, or size up to win it back.
This guide gives you the exact definition of drawdown in trading, how to calculate it, and above all what most articles leave out: which losing streak is statistically normal for your win rate, and which risk per trade lets you get through it.
What is drawdown in trading?
Drawdown is the drop in your capital between a high and the lowest point that follows, before that high is exceeded. It is measured as a percentage of the peak.
Maximum drawdown is the largest of these drops over a period. It is the worst losing stretch your account has been through.
An important nuance: drawdown is not measured from your starting capital but from your latest peak. An account that goes from €10,000 to €11,200 and then falls back to €9,800 has only lost 2% of its initial capital. But it went through a 12.5% drawdown, and that number describes what you actually lived through.
How to calculate maximum drawdown
The formula: drawdown = (peak − trough) ÷ peak.
Here is how an account evolved over several weeks (illustrative example):
| Stage | Capital | Highest point so far | Current drawdown |
|---|---|---|---|
| Start | €10,000 | €10,000 | 0% |
| Winning streak | €11,200 | €11,200 | 0% |
| Losing streak | €9,800 | €11,200 | −12.5% |
| Recovery | €12,000 | €12,000 | 0% |
| New dip | €11,400 | €12,000 | −5% |
The account went through two drawdowns: 12.5% and then 5%. The maximum drawdown is 12.5%.
Step by step, in a spreadsheet:
- Compute your capital after each trade (previous capital + net result of the trade).
- In a “highest point” column, keep the maximum reached so far.
- In a “drawdown” column, compute (highest point − capital) ÷ highest point.
- Maximum drawdown is the largest value in that column.
Absolute, relative, balance and equity drawdown: the MetaTrader definitions
MetaTrader reports show several drawdowns, and they do not measure the same thing. Here is what the official MetaTrader 5 documentation says, applied to the example above:
| MetaTrader metric | What it measures | In the example |
|---|---|---|
| Absolute drawdown | Gap between the initial deposit and the lowest point below it | €200 |
| Maximal drawdown | Gap in money between a local high and the next low | €1,400 |
| Relative drawdown | The same gap as a percentage of the high | 12.5% |
| Balance drawdown | Calculated on closed trades only | |
| Equity drawdown | Includes open positions, so often higher |
The number that matters to judge your risk is the maximum relative drawdown. Absolute drawdown can stay tiny even after a severe drop, simply because you had been winning before.
Why a drawdown hurts more than it looks
Because to get back to your peak, you have to gain more than you lost. The math: gain needed = drawdown ÷ (1 − drawdown).
| Drawdown | Gain needed to get back to the peak |
|---|---|
| −5% | +5.3% |
| −10% | +11.1% |
| −20% | +25% |
| −30% | +42.9% |
| −40% | +66.7% |
| −50% | +100% |
| −75% | +300% |
Up to −10%, the effort stays close to the loss. At −30%, you need almost 43%. At −50%, you have to double the account. That is why a deep drawdown pushes traders into revenge trading: the way back looks so long that you look for a shortcut.
What losing streak should you expect?
This is the question nobody asks before trading, and it is the most important one. A losing streak is not necessarily a sign that your strategy is broken: often it is just probability.
We calculated the probability of going through at least one streak of consecutive losses over a sequence of 100 trades, by win rate (exact calculation, assuming independent trades):
| Win rate | At least 4 losses in a row | At least 5 | At least 6 | At least 8 | At least 10 |
|---|---|---|---|---|---|
| 40% | over 99% | 98% | 87% | 49% | 20% |
| 50% | 97% | 81% | 55% | 17% | 4% |
| 60% | 80% | 46% | 21% | 4% | 1% |
Read the row that matches your win rate. At 50%, you will almost certainly hit 5 losses in a row within 100 trades. At 40%, a streak of 8 losses happens about half the time. And if you are not sure yet that your win rate beats your break-even rate, start by checking your win rate over enough trades.
A losing streak you did not expect looks like a broken strategy. A streak you planned for is just a bad week.
How much your risk per trade weighs on your drawdown
Now combine those streaks with your risk per trade. Here is the drawdown caused by a run of consecutive losses when you risk a fixed percentage of the remaining capital on each trade:
| Risk per trade | 5 losses | 8 losses | 10 losses | 15 losses |
|---|---|---|---|---|
| 0.5% | −2.5% | −3.9% | −4.9% | −7.2% |
| 1% | −4.9% | −7.7% | −9.6% | −14% |
| 2% | −9.6% | −14.9% | −18.3% | −26.1% |
| 5% | −22.6% | −33.7% | −40.1% | −53.7% |
A streak of 8 losses, which happens about half the time at a 40% win rate, costs 7.7% of the account at 1% risk. At 5% risk, it costs a third. Same strategy, same streak: only the position size changes.
So the right approach is the reverse of what most traders do:
- Decide the maximum drawdown you accept, for example 15%.
- Estimate the worst reasonable streak for your win rate, for example 10 losses.
- Pick the risk per trade that keeps that streak under your limit: here, 1% (−9.6%) works, 2% (−18.3%) does not. Our guide on how much to risk per trade walks through this choice with a 50,000-sequence simulation.
- Calculate your position size from that risk and your stop loss on every trade.
What drawdown is dangerous?
There is no official threshold for a personal account. These practical benchmarks help you place your current drawdown:
| Current drawdown | Reading | Action |
|---|---|---|
| Under 10% | Normal variation for most strategies | Keep going, without changing size |
| 10 to 20% | Watch zone | Review recent trades and reduce risk |
| 20 to 30% | Danger zone | Cut risk sharply, analyze before resuming |
| Over 30% | Long, hard way back | Pause and run a full review of your history |
At a prop firm, the challenge rules decide. At FTMO, for example, the 1-Step challenge currently sets a maximum daily loss of 3% and a maximum loss of 10% of initial capital, measured on equity, meaning open positions included. With such a limit, a losing streak at 2% risk per trade is enough to fail the challenge.
5 rules to limit your drawdown
- A fixed percentage risk. Chosen from your maximum acceptable drawdown, as explained above. Never increased to recover a loss.
- A daily loss limit. It cuts off disaster days before they deepen the drawdown.
- Lower risk during a drawdown. For example, halve your risk beyond a 10% drawdown and go back to normal at the next peak.
- A stop loss set at entry. A single trade without a stop can create a bigger drawdown than an entire losing streak.
- A weekly check. Write down your current and maximum drawdown every week, along with your profit factor: together, they tell you whether your strategy makes money and at what cost.
Tracking your drawdown with TradeIA
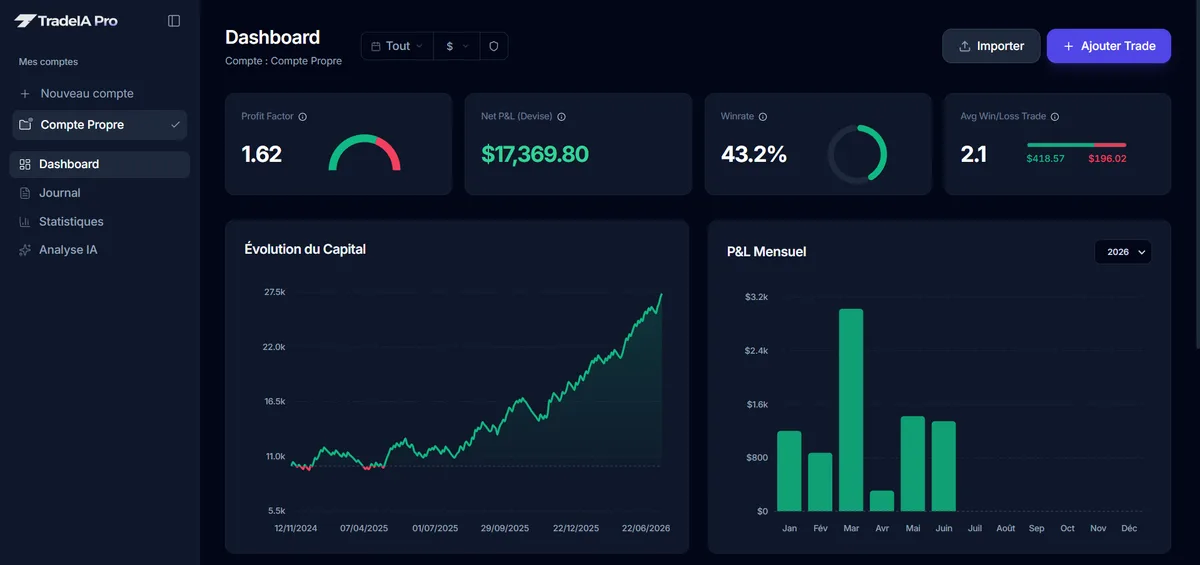
TradeIA computes your maximum drawdown, in money and as a percentage, as soon as you import your MT4, MT5, cTrader or TradingView history, and draws your equity curve so you can see every downswing. The analysis also flags when your risk varies too much from one trade to the next, or when your size grows during a losing streak: two behaviors that deepen drawdowns.
In short
Drawdown measures the drop in your capital from its latest peak, and maximum drawdown the worst of those drops. Losing streaks are statistically unavoidable: at a 50% win rate, 5 losses in a row are almost certain over 100 trades. What decides how much they hurt is your risk per trade. Set your acceptable drawdown first, derive your risk from it, and you will no longer mistake a bad streak for a broken strategy.
Frequently asked questions
05What is drawdown in trading?
It is the drop in your capital between a peak and the lowest point reached before you get back to that peak. It is expressed as a percentage of the peak. An account that goes from €11,200 to €9,800 suffers a 12.5% drawdown, even if it is still close to its starting capital.
How do you calculate maximum drawdown?
Track your capital trade by trade, note each new high, then the lowest point reached before the next high. For each drop, compute (peak − trough) ÷ peak. Maximum drawdown is the largest of these values over the period.
What drawdown is acceptable in trading?
There is no official threshold. Many retail traders aim for a maximum drawdown below 10 to 20%, because beyond that the gain needed to recover rises quickly and the psychological pressure leads to mistakes. At a prop firm, the challenge rules set the limit.
What is the difference between balance drawdown and equity drawdown?
Balance only reflects closed trades. Equity includes positions that are still open. Equity drawdown is therefore always equal to or greater than balance drawdown, and it is often the one prop firms monitor.
How many losses in a row should you expect?
It depends on your win rate and the number of trades. Over 100 trades with a 50% win rate, a streak of at least 5 losses happens in 81% of cases and a streak of 6 in 55% of cases. At 40%, a streak of 8 happens about half the time. Size your risk so you survive these streaks.
Sources
03Educational content. It does not constitute investment advice. Trading leveraged products carries a high risk of losing your capital.