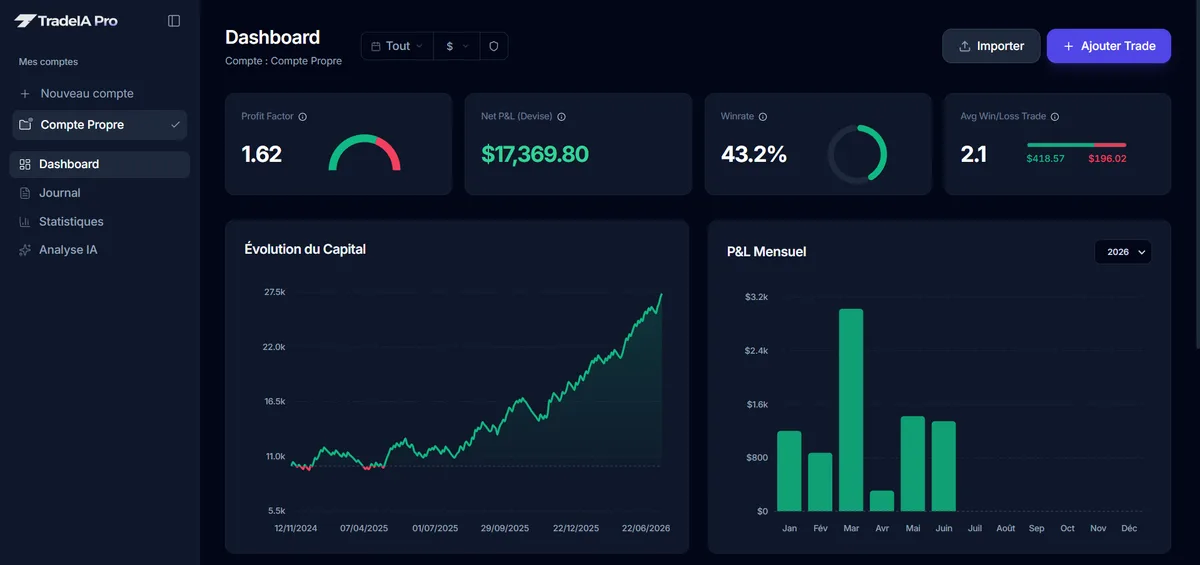
In short
The profit factor is the ratio between the sum of your gains and the sum of your losses over a period: 1 means you break even, above 1 you make money. It depends on your win rate and on your average win to average loss ratio. It is only meaningful when computed after fees, over enough trades.
Key takeaways
- The profit factor divides the sum of winning trades by the sum of losing trades: above 1, your strategy made money over the period.
- It follows from two numbers: profit factor = win rate ÷ (1 − win rate) × average win / average loss.
- Fees weigh heavily: in our example, €8 per trade takes a profit factor from 1.20 down to 1.04 and wipes out 80% of the profit.
- A profit factor says nothing about the order of trades: two accounts with the same profit factor can have very different drawdowns.
- Remove your best trade and recompute: if the profit factor drops below 1, your profitability rests on a single lucky trade.
Your month ends in the green, but you do not know whether your strategy works or you just got lucky. The profit factor answers part of that question, as long as you compute it correctly and know what it does not tell you.
This guide gives you the formula, a table showing what profit factor to expect for your win rate and reward ratio, the real effect of fees, and a simple test to check that your number is not a mirage.
What is the profit factor?
The profit factor is the ratio between the sum of your gains and the sum of your losses. The official MetaTrader 5 documentation defines it as the ratio of gross profit (the sum of all winning trades) to gross loss (the sum of all losing trades), noting that a value of 1 means the two are equal.
It reads instantly:
- Below 1: you lose more than you win over the period.
- Exactly 1: you break even.
- Above 1: you make money. A profit factor of 1.5 means you earn €1.50 for every euro lost.
It is one of the most useful numbers in a trading journal, because it sums up the profitability of a strategy in a single figure, regardless of account size.
How to calculate the profit factor
The formula fits on one line: profit factor = sum of gains ÷ sum of losses (in absolute value).
Example over a month of 20 trades (illustrative example):
| Item | Value |
|---|---|
| Winning trades | 9 |
| Losing trades | 11 |
| Sum of gains (gross profit) | +€2,400 |
| Sum of losses (gross loss) | −€1,600 |
| Net result | +€800 |
| Profit factor | 2,400 ÷ 1,600 = 1.5 |
In a spreadsheet, if column R holds the net result of each trade, the formula is: =SUMIF(R:R,">0")/ABS(SUMIF(R:R,"<0")).
Three rules to get the number right:
- Use net results: commissions and swaps included. A profit factor computed before fees is flattering and wrong.
- Include every trade of the period, including the ones you would rather forget.
- Do not mix accounts that run very different strategies or risk levels.
Profit factor, win rate and reward ratio: the formula that ties them together
The profit factor is not an independent number. It follows exactly from your win rate and your ratio between average win and average loss:
Profit factor = win rate ÷ (1 − win rate) × (average win ÷ average loss)
This is the formula missing from most explanations, and it changes how you read your statistics. Here is the profit factor you get for each combination:
| Win rate | Ratio 0.5 | Ratio 1 | Ratio 1.5 | Ratio 2 | Ratio 3 |
|---|---|---|---|---|---|
| 30% | 0.21 | 0.43 | 0.64 | 0.86 | 1.29 |
| 40% | 0.33 | 0.67 | 1.00 | 1.33 | 2.00 |
| 50% | 0.50 | 1.00 | 1.50 | 2.00 | 3.00 |
| 60% | 0.75 | 1.50 | 2.25 | 3.00 | 4.50 |
| 70% | 1.17 | 2.33 | 3.50 | 4.67 | 7.00 |
What this table teaches you:
- A high win rate guarantees nothing. With 70% winning trades and wins half the size of your losses, your profit factor is only 1.17, and fees can wipe it out.
- A low win rate can be very profitable. At 40% with a ratio of 3, your profit factor reaches 2. To find the minimum win rate your own ratio requires after fees, there is a simple formula.
- You have two levers to improve your profit factor: win more often, or let your winners run and cut your losers sooner. The second one often depends more on your discipline than on your strategy.
Win rate flatters the ego, profit factor pays the bills. A trader who wins 7 times out of 10 can still empty their account.
What is a good profit factor?
There is no official standard. The thresholds below are practical benchmarks to adapt to your style: a scalper taking hundreds of trades does not have the same requirements as a swing trader taking fifteen a month.
| Profit factor | Reading | What to do |
|---|---|---|
| Below 1 | The strategy loses money | Break it down by setup before going on |
| 1 to 1.2 | Fragile profitability | Check the effect of fees and slippage |
| 1.2 to 1.5 | Decent, to be confirmed | Collect more trades, watch the drawdown |
| 1.5 to 2 | Solid | Keep the same discipline |
| Above 2 | Very good | Check the sample and run the best trade test |
| Above 3 on few trades | Suspicious | Suspect luck or an over-optimized backtest |
The effect of fees on your profit factor
Fees shrink every win and deepen every loss. On a tight profit factor, they can make all the difference.
Take 100 trades with a 50% win rate, an average win of €120 and an average loss of €100, then add €8 of fees per trade, commission and spread included (illustrative example):
| Before fees | After €8 of fees per trade | |
|---|---|---|
| Average win | +€120 | +€112 |
| Average loss | −€100 | −€108 |
| Sum of gains | +€6,000 | +€5,600 |
| Sum of losses | −€5,000 | −€5,400 |
| Net result | +€1,000 | +€200 |
| Profit factor | 1.20 | 1.04 |
Fees ate 80% of the profit. This is not just a forex issue. In their study published in 2000 in the Journal of Finance, Brad Barber and Terrance Odean followed 66,465 investing households: the fifth that traded the most earned an 11.4% annual return, compared with 17.9% for the market. Most of the gap came from transaction costs.
The limits of the profit factor
The profit factor is useful, but it has three blind spots you need to know.
1. It ignores the order of trades
Two accounts with the same profit factor of 1.5 can have lived through very different things. One alternated wins and losses, the other strung together ten losses before catching up. The second went through a drawdown that could have pushed them to quit or to overtrade. Always read the profit factor alongside the maximum drawdown.
2. It is unstable over few trades
Over 10 or 20 trades, a single result can flip the number. Aim for at least 30 trades before drawing a conclusion, and ideally around a hundred to judge a strategy.
3. It can rest on a single trade
This is the most common trap. Picture 10 trades: 9 losses of €100 and one win of €1,500 (illustrative example). Profit factor: 1,500 ÷ 900 = 1.67. On paper, it looks solid. In reality, all the profitability comes from a single trade.
The best trade test
To find out whether your profit factor holds up, run this two-minute test:
- Compute your profit factor over the period.
- Remove your best trade from the list.
- Compute it again.
| Situation | Full profit factor | Without the best trade | Reading |
|---|---|---|---|
| Spread-out profitability (20-trade example, best trade +€200) | 1.50 | 1.38 | Your strategy holds |
| Concentrated profitability (9 losses of €100, one win of €1,500) | 1.67 | 0 | Everything rests on one lucky trade |
In the first case, the drop is moderate: your gains come from many trades. In the second, the number collapses: your next run may never see that exceptional trade again. If your profit factor falls below 1 without your best trade, reduce your risk until the strategy has proven itself over more trades.
Where to find your profit factor in MetaTrader
- MetaTrader 4: in the Account History tab, right-click and choose Save as Detailed Report. The summary shows gross profit, gross loss and profit factor. Careful: the Profit column excludes commission and swap, and our guide to exporting your MT4 trade history shows how to work out your net result.
- MetaTrader 5: account reports and strategy tester reports show the profit factor in their summary.
- cTrader, TradingView or others: export your history and use the spreadsheet formula above.
Make sure the period covers all your trades, and that deposits and withdrawals are not counted as gains or losses.
Tracking your profit factor with TradeIA
TradeIA computes your profit factor automatically as soon as you import your MT4, MT5, cTrader or TradingView history, along with your win rate, average win, average loss and maximum drawdown. Because each trade is linked to its setup, date and asset, you also see which segments pull your profit factor up or down.
The overall number tells you whether you make money. The breakdown tells you where.
In short
The profit factor divides your gains by your losses: above 1, you make money. It follows from your win rate and your reward ratio, should always be computed after fees, and only becomes reliable with enough trades. Before celebrating a good number, run the best trade test: it tells you whether your profitability is a strategy or a stroke of luck.
Frequently asked questions
05How do you calculate the profit factor?
Add up the result of all your winning trades, then the result of all your losing trades in absolute value, and divide the first total by the second. With €2,400 of gains and €1,600 of losses, the profit factor is 1.5. Use net results, including fees and swaps.
What is a good profit factor in trading?
There is no official standard. In practice, below 1 the strategy loses money, between 1 and 1.2 it remains fragile against fees and slippage, from 1.5 it is solid, and above 3 on few trades you should suspect a sample that is too small or an over-optimized backtest.
What is the difference between profit factor and win rate?
The win rate counts the share of winning trades without looking at their size. The profit factor compares the amounts won and lost. A trader can have a 35% win rate and a profit factor of 1.6 if their wins are three times larger than their losses.
Where do you find your profit factor in MetaTrader?
In MetaTrader 4, go to the Account History tab, right-click and choose Save as Detailed Report: the profit factor appears in the summary. MetaTrader 5 shows it in its reports and in strategy tester reports. Otherwise a spreadsheet with two SUMIF formulas is enough.
How many trades do you need for a reliable profit factor?
There is no magic threshold, but a profit factor computed over 10 or 20 trades can change completely with the next trade. Aim for at least 30 trades, ideally 100, and check that it does not rest on one or two exceptional wins.
Sources
03- MetaQuotes, MetaTrader 5 Help: Testing Report (definitions of profit factor, gross profit and gross loss)
- MetaQuotes, MetaTrader 4 Help: Account History (detailed report)
- Barber and Odean, Trading is hazardous to your wealth: the common stock investment performance of individual investors, Journal of Finance (2000)
Educational content. It does not constitute investment advice. Trading leveraged products carries a high risk of losing your capital.