In short
Your win rate is the share of your closed trades that end in profit. The minimum win rate to be profitable is 1 ÷ (1 + average win to average loss ratio): 50% at a ratio of 1, 33.3% at 2, 25% at 3. Fees push this threshold up by several points, and under about 100 trades your measured win rate is too imprecise to judge.
Key takeaways
- The minimum win rate to be profitable comes from one formula: 1 ÷ (1 + ratio between your average win and your average loss).
- Fees raise that threshold: with a ratio of 2 and fees of 0.1 R per trade, you need 36.7% winners instead of 33.3%.
- Use your realized ratio, not your target: across 12 million trades analyzed by DailyFX, clients won 59% of the time on EUR/USD and still lost money.
- Over 100 trades, a win rate measured at 50% has a margin of error of about 10 points: your true rate could be anywhere from 40% to 60%.
- A win rate only means something next to your break-even rate after fees: clearly above it, your strategy has an edge; inside the margin of error, you do not know yet.
You win more often than you lose, and your account still goes down. Or the opposite: you lose six trades out of ten and wonder whether to change everything. Either way, your win rate alone tells you nothing. You need to compare it to a threshold, and that threshold depends on your ratio and your fees.
This guide to your trading win rate gives you the formula for the minimum win rate, a table that includes fees, the margin of error for your number of trades, and a method to run the numbers on your own MT4 or MT5 history.
What is the win rate in trading?
The win rate is the share of your closed trades that end in profit, as a percentage. If you closed 120 trades and 54 were winners, your win rate is 45%.
MetaTrader 5 shows it in its history report as “Profit Trades (% of total)”, meaning the number of winning trades and their share of the total, according to the official MetaQuotes documentation.
The win rate counts trades, not money. It says nothing about the size of your wins or your losses. That is exactly why it is so often misread.
Two points before you calculate:
- Trades closed at zero. A trade closed at break-even is neither a win nor a loss. Remove them from the count or track them separately, but always use the same rule.
- Net results. A trade that makes 3 dollars on price but costs 5 dollars in commission and swap is a loss. Calculate your win rate on net results.
What win rate do you need to be profitable? The break-even formula
The minimum win rate to be profitable equals 1 ÷ (1 + R), where R is the ratio between your average win and your average loss. With average wins twice as big as your losses, the threshold is 1 ÷ 3, or 33.3%.
The logic is simple. On each trade, you win R with probability p and lose 1 with probability 1 − p. The average result is zero when p × R = (1 − p), so when p = 1 ÷ (1 + R).
Above that threshold, each trade earns something on average. Below it, each trade costs you money on average, however confident you feel about the setup.
Fees change the math. Express them in R: if you risk 100 per trade and spread, commission and swap cost you 10, your fees are 0.1 R. A win now only brings R − 0.1 and a loss costs 1.1. The threshold becomes:
Minimum win rate = (1 + fees) ÷ (1 + R)
The minimum win rate table, fees included
Here is the minimum win rate to break even depending on your ratio and your fees expressed in R. TradeIA calculation based on the formula above.
| Win/loss ratio (R) | No fees | Fees 0.05 R | Fees 0.1 R | Fees 0.2 R |
|---|---|---|---|---|
| 0.5 | 66.7% | 70.0% | 73.3% | 80.0% |
| 1 | 50.0% | 52.5% | 55.0% | 60.0% |
| 1.5 | 40.0% | 42.0% | 44.0% | 48.0% |
| 2 | 33.3% | 35.0% | 36.7% | 40.0% |
| 2.5 | 28.6% | 30.0% | 31.4% | 34.3% |
| 3 | 25.0% | 26.2% | 27.5% | 30.0% |
| 4 | 20.0% | 21.0% | 22.0% | 24.0% |
Three useful readings:
- Fees hurt more when the ratio is low. At a ratio of 0.5, going from 0 to 0.2 R in fees costs you 13.3 extra points of win rate. At a ratio of 4, only 4 points.
- Scalping is the most exposed. A tight stop makes fees heavy in R: 10 in fees is 0.05 R on a 200 risk, but 0.2 R on a 50 risk.
- A 55% threshold is not trivial. With a ratio of 1 and 0.1 R in fees, winning one trade out of two loses you money.
If you want to know by how much you beat the threshold in money terms, the profit factor links your win rate and ratio directly to your gains and losses.
Why a 60% win rate can lose money
A high win rate loses money when your average loss is much bigger than your average win. It is the most common pattern among retail traders, and it is documented across millions of real trades.
In 2011, the DailyFX research team analyzed more than 12 million real trades placed in 2009 and 2010 by clients of a major forex broker. On EUR/USD, the most traded pair, 59% of trades were winners. But the average loss reached 127 pips, against 65 pips for the average win.
Run the formula: the realized ratio was 65 ÷ 127, about 0.51. The break-even rate therefore rose to 1 ÷ 1.51, or 66.1%. With 59% winners, these traders lost about 13.7 pips per trade on average, before any fees. On GBP/JPY it was worse: 66% winning trades, but a 52 pip average win against a 122 pip average loss.
Your win rate never compares to the ratio you aim for. It compares to the ratio you actually get.
Why the gap? Behavioral finance research has described it for a long time. Terrance Odean studied 10,000 accounts at a US broker (Journal of Finance, 1998): a position in profit was more than 50% more likely to be sold than a position at a loss. Investors take their gains quickly and let their losses run.
In your trading, this shows up as take profits moved closer, stop losses widened “just this once”, and manual exits before the target. Your planned ratio is 2, your realized ratio drops to 1 or less, and your threshold climbs without you noticing.
Is your win rate reliable? The margin of error by number of trades
A win rate calculated on a few trades is a very rough estimate. Over 100 trades, a win rate measured at 50% has a margin of error of about 9.8 points at 95% confidence: your true rate could be anywhere between 40% and 60%.
This margin comes from the standard confidence interval for a proportion, described in the NIST statistics handbook: 1.96 × √(p × (1 − p) ÷ n), where p is your win rate and n your number of trades. TradeIA calculation:
| Number of trades | Margin if win rate ≈ 50% | Margin if win rate ≈ 40% | Margin if win rate ≈ 30% |
|---|---|---|---|
| 30 | ± 17.9 points | ± 17.5 points | ± 16.4 points |
| 50 | ± 13.9 points | ± 13.6 points | ± 12.7 points |
| 100 | ± 9.8 points | ± 9.6 points | ± 9.0 points |
| 200 | ± 6.9 points | ± 6.8 points | ± 6.4 points |
| 500 | ± 4.4 points | ± 4.3 points | ± 4.0 points |
| 1,000 | ± 3.1 points | ± 3.0 points | ± 2.8 points |
This formula assumes your trades are independent of each other. If you change setups along the way, or if your trades come in clusters on the same move, the real margin is even wider.
The consequence is direct: judging a strategy on 20 or 30 trades is like flipping a coin. A good week proves nothing, and neither does a bad one. That is also why a trading journal kept over several months is worth more than any weekend backtest.
How to calculate your real threshold from your MT4 or MT5 history
To know whether your win rate is enough, compare it to the threshold calculated from your realized ratio and your real fees, over a large enough sample. Here is the method in 5 steps.
- Export your history. In MetaTrader 5, right-click in the History tab and choose Report. In MetaTrader 4, save the detailed report from the Account History tab (the step by step and the pitfalls are in our guide to exporting your MT4 trade history).
- Note three numbers. Your win rate (Profit Trades (% of total) in MT5), your average win (Average profit trade) and your average loss (Average loss trade).
- Calculate your realized ratio. Divide the average win by the absolute value of the average loss. If those averages are already net of commission and swap, your fees are included: the threshold is then 1 ÷ (1 + ratio).
- Calculate your threshold. If your averages are gross, convert your average fees into R (average fees ÷ average loss) and apply (1 + fees) ÷ (1 + ratio).
- Compare with the margin. Find the margin of error of your win rate in the table above. Your edge is only established if your win rate minus the margin stays above the threshold.
Illustrative example. You closed 120 trades, 54 of them winners: a 45% win rate. Your risk is fixed at 100 per trade, your gross average win is 150 and your average loss is 100, so a ratio of 1.5. Your fees are 10 per trade, so 0.1 R.
| Calculation | No fees | With 0.1 R fees |
|---|---|---|
| Break-even win rate | 40.0% | 44.0% |
| Average result per trade | +0.125 R | +0.025 R |
| Result over 120 trades | +15 R (+1,500) | +3 R (+300) |
| Gap between your win rate and the threshold | +5 points | +1 point |
On paper, you are profitable. But the margin of error of your win rate over 120 trades is about 8.9 points. Your true rate lies somewhere between 36% and 54%, and the 44% threshold sits right inside that range. Honest conclusion: your strategy may be a winner or a loser, and fees decide almost everything.
To lower your fees in R without changing broker, keep a consistent risk per trade: calculating your position size stops you from using stops so tight that fees weigh too much.
What to do based on your result
Your next step depends on the gap between your win rate and your threshold after fees, and on the margin of error. This table sums up the cases.
| Your situation | What it means | Your next step |
|---|---|---|
| Win rate above the threshold, even after subtracting the margin | Likely edge | Keep the setup, watch your drawdown and change nothing without data |
| Win rate above the threshold, but within the margin | Not proven yet | Keep going at reduced size until 100 to 200 trades on that setup |
| High win rate, realized ratio below 1 | You cut winners early or let losers run | Leave your take profit and stop loss in place, no manual intervention |
| Win rate below the threshold with fees, above it without | Fees eat your edge | Trade less often, widen stop and target, compare broker fees |
| Win rate below the threshold, even after adding the margin | Losing strategy on this sample | Stop this setup and go back to backtesting or a demo account |
One rule you can apply from your next session: write down the planned take profit and stop loss on every trade before you enter. In a month, compare your planned ratio with your realized ratio. The gap between the two is often the most telling number in your history.
Tracking your win rate with TradeIA
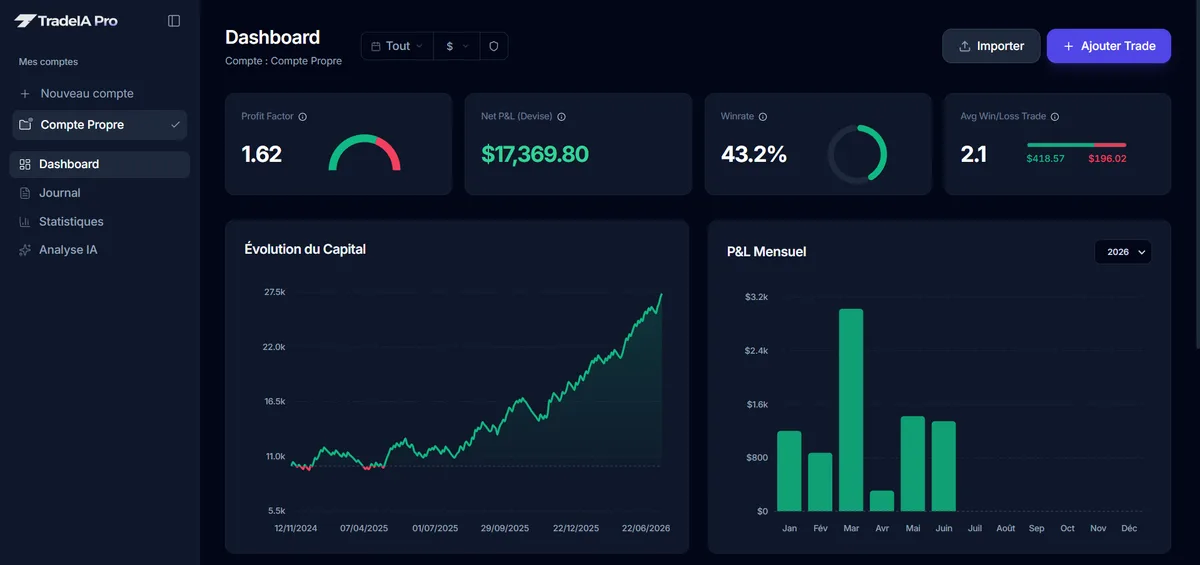
TradeIA calculates your win rate, average win, average loss and profit factor as soon as you import your MT4, MT5, cTrader or TradingView history. The analysis breaks these numbers down by day of the week, by hour and by symbol, and flags for example the days where your win rate drops below 40% with a negative average result, or the hours where it falls below 30%. You see which segments push you below your threshold, instead of a single overall number.
In short
Your win rate tells you how often you win, not how much. To know whether it is enough, calculate your threshold from your realized ratio and your fees: (1 + fees) ÷ (1 + R). Then check that the gap survives the margin of error, which is still about 10 points over 100 trades. A win rate is only good news when it beats that threshold clearly, over enough trades.
Frequently asked questions
05What is a good win rate in trading?
There is no good win rate in absolute terms. A 35% win rate is excellent if your wins are three times bigger than your losses, and a 65% win rate can lose money if your losses are twice as big as your wins. The right number is one that clearly beats your break-even rate after fees.
How do you calculate your win rate?
Divide the number of trades closed in profit by the total number of closed trades, then multiply by 100. With 54 winning trades out of 120, your win rate is 45%. Decide in advance how you count trades closed at zero and keep the same rule every time.
Is a 40% win rate profitable?
Yes, if your average win is more than 1.5 times your average loss after fees. At 40% winners, you break even exactly at a ratio of 1.5 without fees. With fees you need a slightly higher ratio, 1.75 for fees of 0.1 R per trade.
How many trades do you need to know your win rate?
Over 30 trades, the margin of error on a win rate near 50% is more than 17 points, which allows no conclusion. It drops to about 10 points over 100 trades and 7 points over 200. Aim for at least 100 trades on the same setup before you judge your strategy.
Where do you find your win rate in MetaTrader?
In MetaTrader 5, right-click the History tab and choose Report: the Profit Trades (% of total) line is your win rate, next to Average profit trade and Average loss trade. In MetaTrader 4, the detailed account history report shows equivalent statistics.
Sources
04- Rodriguez D. and Shea T., What is the Number One Mistake Forex Traders Make?, DailyFX (2011, archive)
- Odean T., Are Investors Reluctant to Realize Their Losses?, The Journal of Finance (1998)
- MetaQuotes, MetaTrader 5 Help: Trading history report
- NIST/SEMATECH, e-Handbook of Statistical Methods: confidence intervals for a proportion
Educational content. It does not constitute investment advice. Trading leveraged products carries a high risk of losing your capital.