In short
For most retail traders, risking 0.5% to 1% of capital per trade keeps drawdown under control. In our 200-trade simulation, the drawdown hit in the worst one-in-twenty case is about 20 times the risk per trade: 1% leads to around 20%, 2% to around 37%. Pick the drawdown you accept first, then divide it by 20.
Key takeaways
- Between 0.5% and 1% of capital per trade is the sensible range for a retail trader whose strategy does not yet have hundreds of trades of history.
- In our 200-trade simulation, the drawdown reached one time in twenty is about 20 times the risk per trade: 1% leads to around 20%, 2% to around 37%, 3% to around 50%.
- Choose your risk backwards: set the maximum drawdown you accept, divide it by 20, and you get a ceiling for your risk per trade.
- The Kelly criterion often gives 8 to 10% for a profitable strategy, but it assumes a win rate known with certainty: a 5-point error is enough to turn growth into loss.
- In a prop firm, the daily loss limit decides: at 1% risk, three losses are enough to reach a 3% limit.
- Your real risk is in your history: divide each stopped-out loss by the balance before the trade and compare the result with your rule.
Everyone tells you “1 to 2% per trade”. Nobody tells you why, or what actually changes when you go from 1% to 2%. So you pick by feel, and you find out the answer during your first real losing streak.
This guide answers how much to risk per trade with numbers: a simulation of 50,000 trade sequences, the Kelly criterion applied to a real trader, prop firm constraints, and a method to measure your real risk in your own history.
How much to risk per trade, in one sentence?
Between 0.5% and 1% of your capital per trade, as long as you don’t have hundreds of trades of history proving your strategy. Above 2%, drawdowns of 20 to 40% become likely, even with a winning strategy.
Risk per trade is the amount you lose if your stop loss is hit, expressed as a percentage of your capital. With €10,000 and 1% risk, you accept losing €100 on that trade. It isn’t your position size: it’s what your position costs if you’re wrong. The size then follows from that amount and the distance to your stop, as our guide to position size calculation explains.
Why 1% and not 5%?
Because losing streaks happen to everyone, and their cost grows with your risk. A streak of 10 losses in a row costs 9.6% of the account at 1% risk, 18.3% at 2% and 26.3% at 3%.
| Risk per trade | After 5 losses in a row | After 10 losses in a row |
|---|---|---|
| 0.5% | −2.5% | −4.9% |
| 1% | −4.9% | −9.6% |
| 2% | −9.6% | −18.3% |
| 3% | −14.1% | −26.3% |
A streak of 10 losses is nothing exceptional: with a 40% win rate, it shows up in one 100-trade sequence out of five, as we calculated in our article on drawdown. The real problem comes next: the deeper the hole, the larger the gain needed to get out, and the stronger the pull of revenge trading.
What our 50,000-sequence simulation shows
We simulated 50,000 sequences of 200 trades for three profitable strategies, risking a fixed percentage of current capital (illustrative example, independent trades, no fees or slippage). The result: risk per trade barely changes your odds of finishing ahead, but it multiplies the depth of drawdowns.
The three profiles tested:
- Profile A: 40% win rate, average win of 2R (expectancy of +0.2R per trade).
- Profile B: 50% win rate, average win of 1.2R (expectancy of +0.1R).
- Profile C: 55% win rate, average win of 1R (expectancy of +0.1R).
Probability of at least one drawdown of this size over 200 trades:
| Profile | Risk | Drawdown ≥ 10% | Drawdown ≥ 20% | Drawdown ≥ 30% | Drawdown reached 1 time in 20 |
|---|---|---|---|---|---|
| A (40%, 2R) | 0.5% | 8.8% | 0% | 0% | 11% |
| A (40%, 2R) | 1% | 69.6% | 6.8% | 0.3% | 20.9% |
| A (40%, 2R) | 2% | 99.8% | 68.9% | 19.3% | 38.3% |
| A (40%, 2R) | 3% | 100% | 96.4% | 61.6% | 52.5% |
| B (50%, 1.2R) | 1% | 59.2% | 5.1% | 0.2% | 20.1% |
| B (50%, 1.2R) | 2% | 99.3% | 55.1% | 15.1% | 36.8% |
| C (55%, 1R) | 1% | 42.8% | 2.5% | 0% | 17.7% |
| C (55%, 1R) | 2% | 96.7% | 42.5% | 8.3% | 32.8% |
Three takeaways:
- At 1%, a 10% drawdown is normal. It happens in 43 to 70% of sequences. Living through one doesn’t mean your strategy is broken.
- Going from 1% to 2% doesn’t double the risk of a large drawdown, it multiplies it by ten or more. The probability of going past 20% rises from 3 to 7% to 43 to 69%.
- The percentage doesn’t create the edge. With profile B, the share of sequences that finish in the red stays at 11.5% at 0.5%, 1% or 2%. Risk amplifies your result, it doesn’t make it positive.
Your risk per trade doesn’t decide whether you win. It decides how deep the hole is that you’ll have to cross to get there.
How do you choose your percentage from your maximum drawdown?
Start from the drawdown you’re ready to live through, not from the gain you hope for. In our simulation, the drawdown reached one time in twenty is about 20 times the risk per trade (16 to 22 times depending on the profile, between 0.5% and 2% risk): divide your maximum acceptable drawdown by 20 and you get your ceiling.
| Maximum drawdown you accept | Risk per trade ceiling | Reading |
|---|---|---|
| 10% (prop firm, account you can’t top up) | 0.5% | A 10% drawdown stays rare over 200 trades |
| 20% (personal account, average tolerance) | 1% | A 20% drawdown happens about one time in twenty |
| 30% (experienced trader, proven strategy) | 1.5% | Same benchmark, for a long and stable history only |
| 40% and more | 2% | About one sequence in two goes past a 20% drawdown |
The method in four steps:
- Write down the maximum drawdown you accept before changing anything, for example 15%.
- Divide by 20: 15 ÷ 20 = 0.75%. That’s your risk per trade ceiling.
- Round down if your history has fewer than 100 trades or if your win rate varies a lot from month to month.
- Keep this percentage fixed. Never raise it to “win back” a loss.
This 20-times benchmark applies to strategies of this kind over 200 trades. If your wins are very irregular or you hold correlated trades at the same time (several dollar pairs, for example), your real drawdown will be deeper: leave a margin.
What does the Kelly criterion say?
The Kelly criterion gives the fraction of capital that maximizes long-term growth, but it assumes you know your edge exactly. For a strategy that wins 2R with a 40% success rate, it recommends 10% per trade, a level almost no trader should use.
John L. Kelly published it in 1956 in the Bell System Technical Journal. He showed that a bettor who stakes all of their capital every time ends up broke with probability one, and that growth peaks at a precise fraction. Applied to trading, the formula reads:
Kelly fraction = p − (1 − p) ÷ b, where p is your win rate and b your average win in R.
With profile A: 0.40 − 0.60 ÷ 2 = 0.10, or 10% per trade. The trap is in the “p”. Illustrative example: you think you have a 40% win rate, but your real win rate is 35%. Your real Kelly drops to 2.5%, and here is what a typical account becomes after 200 trades:
| Risk per trade | If your win rate really is 40% | If it is actually 35% |
|---|---|---|
| 10% (estimated full Kelly) | ×6.98 | ×0.39, or −61% |
| 5% (estimated half Kelly) | ×4.35 | ×1.00, no progress |
| 1% | ×1.46 | ×1.08 |
Five points of win rate less, and the “optimal” strategy wipes out 61% of the account. That’s why traders who use Kelly take only a small fraction of it. Over 50 or 100 trades, your measured win rate can easily be 5 points away from your true win rate: Kelly is a theoretical ceiling for you, never a setting.
How much to risk per trade in a prop firm?
In a prop firm, the daily loss limit sets your risk, not your strategy. At FTMO, at the time of writing, the 2-Step challenge has a maximum daily loss of 5% and a maximum loss of 10% of initial capital; the 1-Step has 3% per day and 10% trailing on the end-of-day balance. Both are measured on equity, open positions included, and FTMO sets no per-trade limit.
| Risk per trade | Losses that reach a 3% daily limit | Losses that reach a 5% limit | Capital down 10% from initial (simulation, 200 trades) |
|---|---|---|---|
| 0.5% | 6 | 10 | 1 to 2% of sequences |
| 1% | 3 | 5 | 10 to 15% of sequences |
| 2% | 2 (i.e. −4%) | 3 (i.e. −6%) | 33 to 41% of sequences |
At 2% risk, one sequence in three hits the 10% maximum loss in our simulation, without even counting the daily limit. That’s why 0.5% is the most common setting during a challenge, and 1% a ceiling.
What about a small account?
A small account doesn’t justify a big percentage. With €500, 1% is €5: if your broker’s smallest lot forces a higher risk with your stop, cut the size with a micro or cent account, or skip the trade, rather than going up to 5%.
The “my account is small, I can risk it” reasoning leads straight to a 50% drawdown. Yet a small account is exactly where you build the history that tells you whether your strategy works. According to ESMA, the EU securities regulator, which based its 2018 restrictions on this finding, 74 to 89% of retail accounts lose money on CFDs: a small account’s priority is to last long enough to measure something.
How do you measure your real risk in your history?
Your real risk is often different from your rule. To find it, divide each stopped-out loss by your account balance just before the trade. If the average exceeds your rule or the values vary threefold, you aren’t calculating your position size, you’re guessing it.
Step-by-step method on MetaTrader 4 or 5:
- Export your history with at least 50 closed trades. Our guide to export your MT4 history covers the menus.
- Add a “balance before” column in your spreadsheet: starting balance plus the sum of profits from previous trades, in closing order.
- Keep the losses closed at the stop loss, by comparing the close price with the S/L column. Trades closed by hand distort the measurement.
- Calculate the real risk of each trade: loss ÷ balance before × 100.
- Compare the average with your rule, look at the maximum, and calculate the standard deviation divided by the average.
Reading benchmarks (rules of thumb, not standards):
| What you see | What it means |
|---|---|
| Average close to your rule, maximum under 1.5 times your rule | Size calculated correctly |
| Maximum above 2 times your rule | At least one trade escaped the calculation |
| Standard deviation above 50% of the average | Irregular risk, size picked by eye |
| Risk rising after losses | A sign of revenge trading to watch |
What TradeIA checks for you
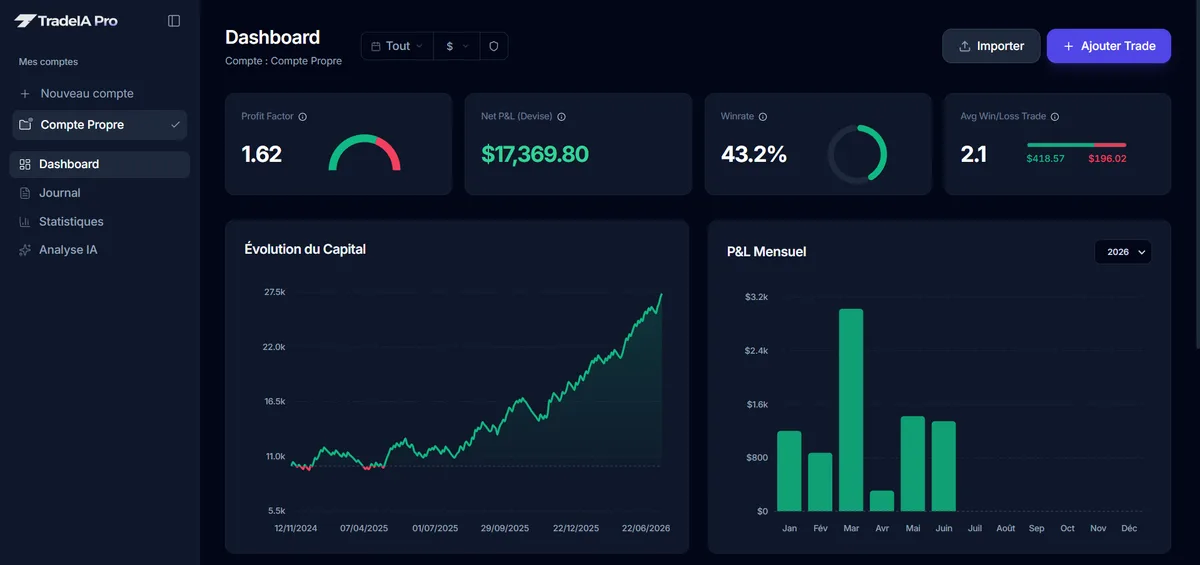
TradeIA imports your MT4, MT5, cTrader or TradingView history and compares the initial risk of your trades with each other: when the standard deviation exceeds 50% of the average on a large enough sample, the analysis flags inconsistent risk. It also spots streaks of at least three losses during which your position size grows by more than 50% from one trade to the next, and tracks your maximum drawdown on your equity curve.
In short
How much to risk per trade? Between 0.5% and 1% for the vast majority of retail traders. The right number follows from the drawdown you accept: divide it by 20. The Kelly criterion gives a theoretical ceiling that is too high for a win rate you never know exactly, and in a prop firm, the daily limit decides for you. Once you’ve chosen your percentage, check in your history that your real risk actually respects it.
Frequently asked questions
05How much should a beginner risk per trade?
Between 0.5% and 1% of capital per trade. Until your strategy has at least a hundred trades of history, you don't know your real win rate, and low risk gives you time to measure it without digging a drawdown that is hard to climb out of.
Is risking 2% per trade too much?
It isn't forbidden, but it is more aggressive than it looks. In our 200-trade simulation, risking 2% pushes drawdown past 20% in 43 to 69% of sequences depending on the strategy, versus 3 to 7% at 1%. It only suits a trader who accepts that level of decline.
How much should I risk per trade on a prop firm challenge?
Usually 0.5% to 1%. Daily loss limits (3% or 5% at FTMO depending on the challenge) and the 10% maximum loss leave little room: at 2% risk, the third loss of the day breaks a 5% limit.
Should I risk a fixed amount or a percentage of my account?
A percentage of the account, recalculated regularly. It automatically shrinks the amount at risk when the account falls and raises it when the account grows. A fixed amount weighs more and more as the account goes down.
How do I know how much I really risk per trade?
Export your history, keep the trades closed at the stop loss and divide each loss by the account balance before the trade. If the average exceeds your rule or the values vary threefold, your position size is set by eye, not from your stop.
Sources
04- J. L. Kelly Jr., A New Interpretation of Information Rate, Bell System Technical Journal, vol. 35 (1956)
- FTMO, Trading Objectives (daily loss and maximum loss limits, accessed October 14, 2026)
- ESMA, ESMA agrees to prohibit binary options and restrict CFDs to protect retail investors (2018)
- MetaQuotes, MetaTrader 4 Help: Account History (history columns and detailed report)
Educational content. It does not constitute investment advice. Trading leveraged products carries a high risk of losing your capital.