In short
Overtrading means taking more trades than your plan and your edge justify, out of boredom, FOMO or to win back a loss. It shows in your trade history: results that get worse after the first trades of the day, busy days that lose more than the others, and fees eating a large share of your gross profit. You stop it with a daily trade limit drawn from your own data.
Key takeaways
- Overtrading is not defined by a number of trades, but by the trades your plan does not justify.
- Trading more does not earn more before costs: in Barber and Odean's study (2000), the most active households earned about the same gross return, but 11.4% net per year versus 18.5% for the least active.
- Every trade without an edge costs at least its spread and commission: the tighter your stop, the heavier that cost weighs in R.
- The most reliable signal in your history is the average result by the trade's rank in the day: the rank where it turns negative is your natural limit.
- A daily trade limit drawn from your data, a closed list of setups and fixed trading windows cut most unnecessary trades.
Your first two trades of the day are good. Then the market slows down, you stay in front of the screen, and every small candle looks like an opportunity. You take a fourth trade, a fifth, a seventh. By the evening, you have given back everything you made in the morning. That is overtrading. And the nasty part is that none of those trades looked crazy at the time.
This guide does not tell you to “trade less”. It shows you how to find out after how many trades you start losing, in your own data, what it really costs, and how to set a limit that holds.
What is overtrading?
Overtrading is taking more trades than your plan and your edge justify. It is not a fixed number: it is the gap between the trades your method allows and the ones you actually take.
It comes in three forms, often mixed together:
- Too many trades: you chain entries on rough setups, out of boredom or to “do something”.
- Too much exposure at once: several positions open on correlated assets, which multiplies your real risk without you seeing it.
- Too much screen time: you trade outside the windows where your strategy works, simply because you are there.
A disciplined scalper taking 15 trades that follow their plan is not overtrading. A swing trader taking 3 trades a week outside their plan is.
Why trading more does not earn more
Because every trade costs money, while it only pays if it has an edge. That is the conclusion of one of the most cited studies in behavioral finance.
Brad Barber and Terrance Odean analyzed the accounts of 66,465 households at a US broker between 1991 and 1996 (Journal of Finance, 2000). Before costs, the households that traded the most and those that traded the least earned almost the same return: between 18.5% and 18.7% per year depending on the group. After commissions and spread, everything changes: 11.4% net per year for the most active, versus 18.5% for the least active, while the market returned 17.9%.
In other words, the heavy traders were not picking worse stocks. They were simply paying for their activity. The authors note that at the time, a round trip of more than $1,000 cost on average 3% in commissions and 1% in spread.
Their explanation: overconfidence. In a second study (Quarterly Journal of Economics, 2001) covering more than 35,000 households, they show that men trade 45% more than women, and that trading reduces their net return by 2.65 percentage points a year, versus 1.72 points for women.
The market does not pay for activity. It pays for the trades that have an edge, and charges you for all the others.
These studies cover US stocks in the 1990s, with higher fees than today. But the mechanism is the same on Forex and CFDs: spread and commission are taken on every trade, winning or losing. And on these products, the 2014 study by the AMF, France’s financial markets authority, already shows that 89% of the 14,799 retail clients studied lost money between 2009 and 2013. The same study shows that the clients who placed the most orders lost the most (see why traders lose money).
What overtrading costs you: a worked example
The cost of a trade is measured in R, that is, as a fraction of your risk. The tighter your stop, the heavier the same spread weighs. With a total cost (spread and commission) of 1.2 pips per round trip (illustrative example):
| Stop size | Cost per trade in R | Trades to pay 1 R in fees |
|---|---|---|
| 5 pips | 0.24 R | about 4 trades |
| 10 pips | 0.12 R | about 8 trades |
| 20 pips | 0.06 R | about 17 trades |
| 50 pips | 0.024 R | about 42 trades |
A scalper with a 5-pip stop pays 1 R in fees roughly every 4 trades. That is why overtrading destroys short-term traders’ accounts first.
Now take a trader with a €10,000 account and 1 R = €100 (illustrative example). Their first 3 trades of the day follow their plan and have a gross expectancy of +0.25 R each. Beyond that, they trade without an edge: a gross expectancy of 0 R. Each trade costs them 0.1 R in fees. Over 20 sessions:
| Trades per day | Gross result | Fees | Net result |
|---|---|---|---|
| 3 | +€1,500 | −€600 | +€900 |
| 6 | +€1,500 | −€1,200 | +€300 |
| 10 | +€1,500 | −€2,000 | −€500 |
Same strategy, same gross result, same good trades. The trader taking 10 trades a day turns a winning month into a losing one without a single disaster trade. Their extra trades do not lose on average before costs: they lose only because of the fees. That is exactly what Barber and Odean observed at scale.
And that is the optimistic scenario. In reality, trades taken out of boredom or after a loss often have a negative gross expectancy, which widens the gap even more and drags your profit factor down.
How to know if you are overtrading: 4 measures in your trade history
Your gut feeling is not enough: you remember the good trades, not the small useless ones. Export your history and run these four measures. In MetaTrader 5, open the History tab, right-click, then Report: the summary tab shows your total commissions and swaps. In MetaTrader 4, use “Save as Detailed Report” from the Account History. On cTrader or TradingView, export your history as CSV.
| Measure | How to calculate it | Warning sign (benchmark) |
|---|---|---|
| Result by trade rank | Average result of the 1st, 2nd, 3rd, 4th and later trades of each day | Negative average result from a given rank onwards |
| Trades per day and daily result | Group your days: 1 to 3 trades, 4 to 6, 7 or more | Your busiest days are your worst days |
| Weight of fees | Commissions, swaps and estimated spread, divided by your gross profit | Fees absorb a growing share of your gross profit |
| Off-plan trades | Share of trades with no identified setup in your journal | More than a few trades a week with no written setup |
1. Result by trade rank
This is the most telling measure. Number your trades within each day (1st, 2nd, 3rd…), then calculate the average result of each rank over at least two months. If your trades 1 to 3 are positive and everything after is negative, you have found your limit: it is not theoretical, it comes from your own numbers.
2. Busy days
Sort your days by number of trades and compare their average result. For a trader who overtrades, days with 7 trades or more are rarely winning days: they are days spent trying to win back losses or to “make the session worth it”.
3. Weight of fees
Add up commissions, swaps and an estimate of the spread you paid, then compare that total to your gross profit. If your strategy wins before costs but you are losing net, your problem is not your method: it is your volume.
4. Off-plan trades
If you keep a trading journal, count the trades with no setup noted. They are almost always boredom, FOMO or revenge trades. Their combined result is the direct cost of your overtrading.
Overtrading, revenge trading or FOMO: how to tell them apart?
Overtrading is the symptom, revenge trading and FOMO are two of its causes. Telling them apart lets you pick the right rule.
| Behavior | Trigger | Trace in your history | Rule that stops it |
|---|---|---|---|
| Overtrading out of boredom | Quiet market, open screen | Small mid-session trades, no setup | Fixed windows, platform closed outside them |
| Revenge trading | A loss | Trade opened minutes after a loss, bigger size | Mandatory break, daily loss limit |
| FOMO | A move that has already started | Late entries, wide or missing stop | No entry without a level set in advance |
| Legitimate active strategy | A written setup | Stable result whatever the trade’s rank | None: keep it, just check the fees |
6 rules to stop overtrading
The principle: you decide before the session, not during it. Once you are in front of the screen, every trade looks justified.
- Set a daily trade limit drawn from your data. Take the rank where your average result turns negative (measure 1) and stop just before it. Write it down before you open the platform.
- Trade a closed list of setups. Two or three written setups, with their entry conditions. No setup from the list, no trade, even if “it looks good”.
- Define your trading windows and close the platform outside them. Find in your history the hours when you win and the hours when you lose. Outside your windows, the app is closed, not minimized.
- Set a daily loss limit. For example 2 to 3 times your risk per trade. Once it is hit, the session is over. It breaks the loss, frustration, new trade loop.
- Calculate your cost per trade in R before choosing your stop. If your fees exceed 0.1 or 0.2 R per trade, your edge has to be clearly larger. Otherwise, widen your time frame or cut your number of trades. Your position size then needs recalculating to keep the same risk.
- Review your off-plan trades every week. Count them and add up their result. Next week’s goal is not to earn more, it is to have fewer of them.
Detecting overtrading automatically
Running these measures by hand in a spreadsheet takes time, especially the result by rank and by time slot. A trading journal that reads your history does it for you.
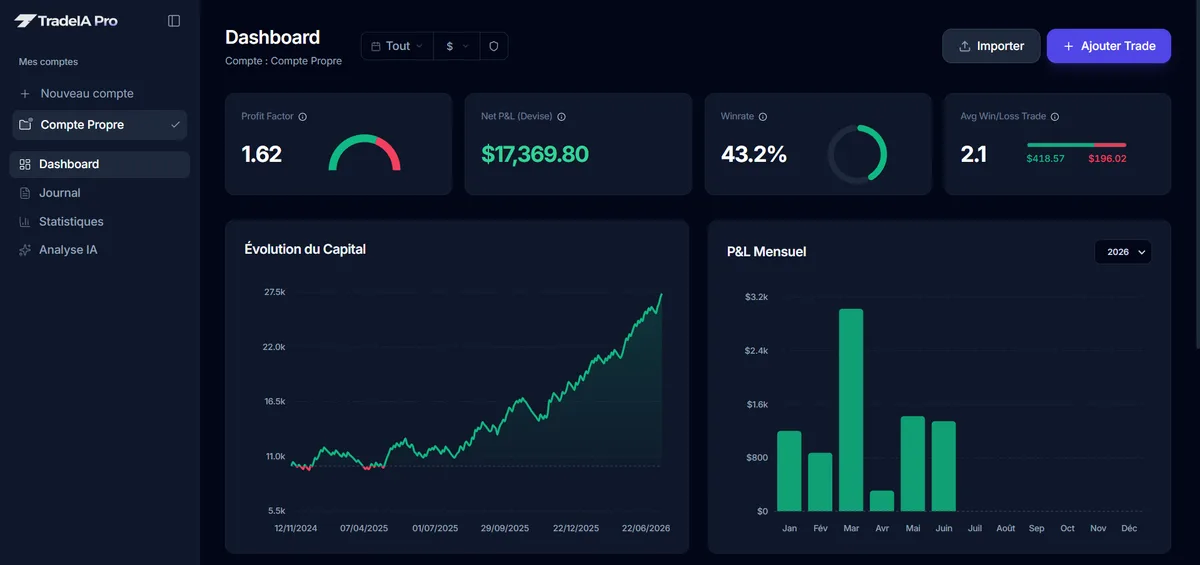
In TradeIA, you import your MT4, MT5, cTrader or TradingView history. The analysis flags, among other things, days when your number of trades exceeds three times your daily average, and hourly slots where your win rate drops below 40% with a negative average result. You see when overtrading happens, at what time, and how much it costs you.
Whatever tool you use, what matters is turning a feeling (“I trade too much”) into a number (“from my 4th trade on, I lose”). That number is something you can turn into a rule.
In short
Overtrading cannot be seen trade by trade, it shows up in the total. Trading more does not earn more before costs, and every trade without an edge costs you at least its fees. Start this week with a single measure: your average result by trade rank within the day. The rank where it turns negative is your limit.
Frequently asked questions
05How many trades per day counts as overtrading?
There is no universal number: a scalper can take 15 clean trades, a swing trader can overtrade with 3. The right benchmark is personal. Check in your history from which rank in the day your average result turns negative: beyond that point, you are trading more than your edge.
What is the difference between overtrading and revenge trading?
Overtrading means taking too many trades, whatever the reason: boredom, FOMO, a need for action. Revenge trading is one specific cause: jumping back in right after a loss to win it back, often with a bigger size. Revenge trading almost always leads to overtrading, but not the other way around.
Is scalping always overtrading?
No. Scalping is a high-frequency strategy that can be perfectly disciplined if every trade follows a defined setup. But it is the most exposed to costs: with a 5-pip stop, a 1.2-pip cost already represents 0.24 R per trade. A scalper has to check that their edge covers those fees.
Why do I trade out of boredom?
Because an open screen makes it feel like you have to act, and waiting for a setup feels like wasted time. The market does not pay for activity, it pays for good decisions. Setting precise trading windows and closing the platform outside them is the simplest fix.
Is a daily trade limit enough to stop overtrading?
It cuts volume, but not necessarily bad trades: you can burn your three allowed trades on mediocre entries. It works better combined with a closed list of setups and a weekly review of the trades taken outside your plan.
Sources
04- Barber B. and Odean T., Trading Is Hazardous to Your Wealth: The Common Stock Investment Performance of Individual Investors, The Journal of Finance (2000)
- Barber B. and Odean T., Boys Will Be Boys: Gender, Overconfidence, and Common Stock Investment, The Quarterly Journal of Economics (2001)
- AMF (France's financial markets authority), study of retail investors' results trading CFDs and Forex in France (2014)
- MetaQuotes, Trading Report, MetaTrader 5 Help
Educational content. It does not constitute investment advice. Trading leveraged products carries a high risk of losing your capital.