In short
A trading journal is a record of every trade (asset, direction, size, entry, exit, result) plus the why behind it: setup, whether you followed your plan, and your emotional state. It only pays off when you analyze it: a monthly review by setup, time of day and plan discipline shows which trades make you money and which ones cost you.
Key takeaways
- A trading journal records the data of every trade and, above all, the why: the setup, whether you followed your plan and your emotion when you entered.
- According to a 2016 meta-analysis of 138 studies, monitoring your progress improves goal attainment, and the effect is stronger when you write it down.
- Four fields carry most of a journal's value: the setup, the risk in R, whether the plan was followed and your emotion in one word.
- A journal you never reread is useless: a monthly review by setup, time of day and plan discipline is enough to find your recurring losing trades.
- Do not draw conclusions from a group of fewer than 20 to 30 trades: below that, chance weighs more than your behavior.
You have probably started a trading journal before. A spreadsheet with twenty columns, filled in seriously for ten days, then forgotten. The problem was not your motivation. It was the journal: too many fields to fill in, and no method to get anything out of it.
This guide gives you the 14 fields that actually matter, the format that fits the way you trade, and above all a 5-step review method, with a worked example, to turn your journal into decisions.
What is a trading journal?
A trading journal is a record of each of your trades, enriched with the context of your decision. Your broker’s history tells you what happened. Your journal tells you why.
It holds two kinds of information:
- The trade data: date, asset, direction, size, entry and exit price, stop loss, result.
- The decision context: the setup you followed, whether you stuck to your plan, your emotional state when you entered.
Your platform already produces the first part. The second part exists nowhere but in your journal, and it is what explains your results.
Why keeping a trading journal changes your results
Because you only fix what you measure. That is not a coaching slogan: it is a solid research finding.
In 2016, Benjamin Harkin and his colleagues published a meta-analysis of 138 studies covering 19,951 participants in the journal Psychological Bulletin. The conclusion: monitoring your progress significantly improves goal attainment, and the effect is stronger when the monitoring is written down or made visible. A trading journal is exactly that.
The stakes are real. According to ESMA, the European markets regulator, between 74% and 89% of retail accounts lose money on CFDs, with average losses of €1,600 to €29,000 per investor depending on the country (figures published in 2018). In France, the 2014 study by the AMF, France’s financial markets authority, covering 14,799 Forex and CFD clients, found 89% of them lost money. We break down the causes of these losses, figure by figure, in our analysis of why traders lose money.
And the margin between losing and winning is thin. The study by Brad Barber, Terrance Odean and their coauthors on Taiwanese day traders (Journal of Financial Markets, 2014) shows that less than 1% of them make money in a predictable, consistent way after fees.
When the gap between losing and winning comes down to a few repeated mistakes, the trader who can see them has an edge over the one who cannot.
What to record in a trading journal: the 14-field template
A good journal takes less than a minute per trade. Any longer and you will stop. Here are the 14 fields that are enough, ranked by usefulness.
| Field | Example | What it is for |
|---|---|---|
| Entry date and time | 09/12, 3:42 pm | Spotting your losing hours |
| Asset | EURUSD | Comparing your results by market |
| Direction | Buy | Seeing whether you do better buying or selling |
| Size | 0.50 lot | Detecting sizes that grow after a loss |
| Entry price | 1.1032 | Computing the result and the R |
| Stop loss | 1.1012 | Measuring your real risk |
| Take profit | 1.1072 | Checking your planned ratio |
| Exit price | 1.1060 | Computing the result |
| Net result (after fees) | +$140 | The basis of every statistic |
| Risk in R | 1 R = $100 | Comparing trades of different sizes |
| Setup | Breakout | Knowing which strategy pays |
| Plan followed | Yes / No | Separating normal losses from mistakes |
| Emotion in one word | Impatient | Linking your states to your results |
| Chart screenshot | Link or image | Reviewing the context with a cool head |
The four fields in bold carry almost all of the journal’s value. Your MT4, MT5, cTrader or TradingView history already contains the first nine: do not type them again if you can import them.
Two rules to keep the journal useful:
- A closed list of setups. Three to five names at most, always spelled the same way. “Breakout”, “H1 breakout” and “break” in the same column make any analysis impossible.
- Fill in “plan followed” honestly. Nobody but you will read your journal. A convenient “yes” is false data that will cost you money.
Excel, Notion or an automatic journal: which format should you choose?
The best format is the one you will still be filling in three months from now. What matters is not the number of features but how long data entry takes and how easy the analysis is.
| Format | Data entry time | Analysis | Best for |
|---|---|---|---|
| Paper notebook | Fast for feelings, slow for numbers | Almost impossible after a few weeks | Recording emotion and plan, as a complement |
| Excel or Google Sheets | 1 to 3 minutes per trade, manual entry | Possible with pivot tables you build yourself | Few trades per week, comfortable with formulas |
| Notion | Similar to Excel | Simple filters, limited calculations | People who favor notes and screenshots |
| Journal that imports your history | A few seconds: only setup, plan and emotion are left to fill in | Statistics computed automatically | Many trades, or after giving up on other formats |
If you take a few swing trades a month, a spreadsheet is plenty. If you scalp or day trade, manual entry becomes the main reason people quit: automate the numbers and save your energy for the context.
How to analyze your trading journal: the 5-step method
Analyzing a journal means splitting your trades into groups and comparing the groups with each other. Once a month, block 30 minutes and follow these five steps.
- Check that your data is complete. Every trade of the month is there, each one has a setup, an R and an answer to “plan followed”.
- Compute your overall numbers. Number of trades, win rate, net result, profit factor and maximum drawdown. That is your baseline.
- Split by setup. For each setup: number of trades, win rate, net result. One setup can drag everything else down.
- Split by plan discipline and by time of day. Compare “plan followed” trades with the others, then your results by time slot and by number of trades in the day: that is the measure that reveals overtrading.
- Write down a single decision. One rule to apply next month, not five. The month after, you check whether it worked.
A worked example of a monthly review
Take a trader with a €10,000 account who risks 1% per trade, so 1 R = €100. They took 40 trades during the month (illustrative example).
| Setup | Trades | Win rate | Gains | Losses | Net result |
|---|---|---|---|---|---|
| Breakout | 18 | 50% | +€1,620 | −€900 | +€720 |
| Pullback | 14 | 43% | +€1,200 | −€800 | +€400 |
| Off-plan | 8 | 25% | +€240 | −€780 | −€540 |
| Total | 40 | 42.5% | +€3,060 | −€2,480 | +€580 |
The month is positive, +€580, and the trader could stop there. The breakdown tells a different story. The 8 off-plan trades have a 25% win rate and an average loss of €130, or 1.3 R: the stop was widened along the way. They cost €540.
Without them, the month would have ended at +€1,120, almost double, with a profit factor of 1.66 instead of 1.23. The decision for the month writes itself: no trade without a setup from the closed list.
A word of caution: 8 trades is not much to judge a setup. But off-plan trades, taken outside any strategy, have nothing to validate. To compare two real setups with each other, wait until you have 20 to 30 trades per setup before concluding.
The questions to ask at every review
| Question | Columns to cross | Possible decision |
|---|---|---|
| Which setup really pays? | Setup, net result | Reduce or drop the losing setup |
| Do my losses come from the market or from me? | Plan followed, result | Stricter entry rule |
| At what time do I lose? | Time, result | Stop trading the losing time slot |
| Do my emotions cost me money? | Emotion, result | Mandatory break in that state |
| Does my size grow after a loss? | Size, result of previous trade | Fixed risk per trade, see revenge trading |
The mistakes that make a journal useless
Most journals fail for the same reasons:
- Too many columns. Every extra field lowers the odds you will fill it in tomorrow. Start with the 14 fields above and add only what you actually reread.
- Recording only winning trades, or only losing ones. A selective journal distorts every statistic. Every trade, no exceptions.
- Filling it in from memory at night. An emotion written down three hours later is not the same emotion. Write it right after entering.
- Never rereading it. Without a review, a journal is just a history that takes longer to produce. The monthly review is the part that pays.
- Changing five rules at once. If you change everything, you will never know what worked. One decision per month.
Keeping your journal without manual entry using TradeIA
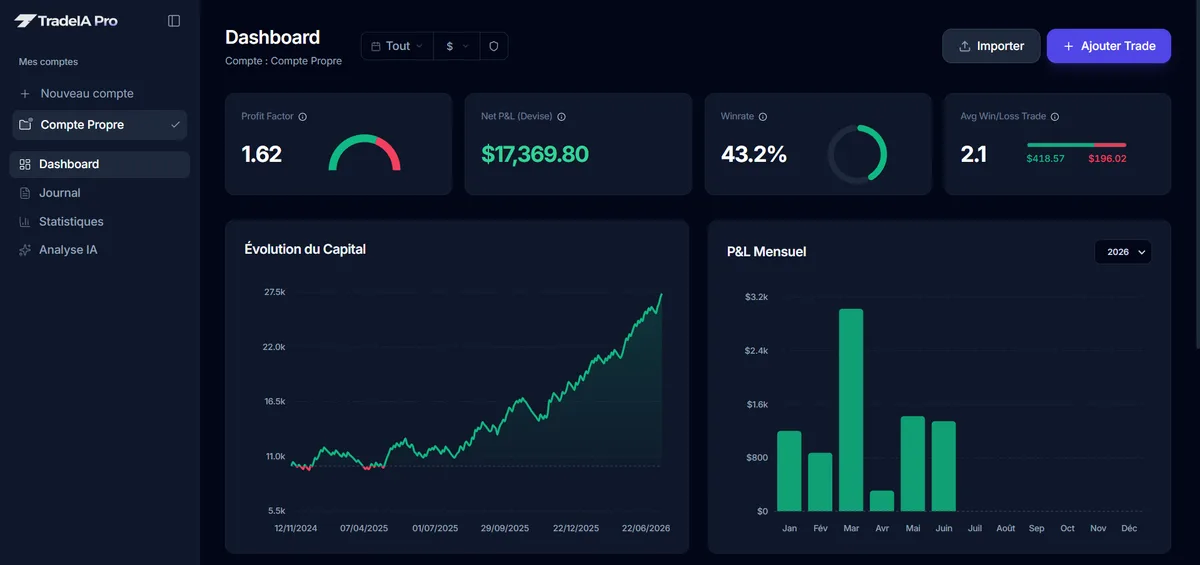
The numbers in a journal are re-entry work: your broker already has all that data. TradeIA imports your MetaTrader 4, MetaTrader 5, cTrader or TradingView history directly and automatically computes your win rate, profit factor, drawdown and results by asset, by day and by hour.
For each trade, you can add the setup, notes, a screenshot, the mistakes you made, your emotional state and whether you followed your plan. The analysis also flags recurring patterns, such as a position size that grows during a losing streak or a risk that varies too much from one trade to the next.
The tool does not do the review for you. It saves you the time spent on data entry and calculations so the 30 minutes each month go into making decisions.
In short
A useful trading journal fits in 14 fields, and four of them do most of the work: setup, risk in R, plan followed, emotion. It takes a minute to fill in and gets reviewed once a month by splitting your trades by setup, time of day and plan discipline. Start tonight with your next trade, and block 30 minutes at the end of the month for your first review.
Frequently asked questions
05What should you record in a trading journal?
The trade data (date, asset, direction, size, entry and exit price, stop loss, result, fees) and the decision context: the setup you used, the risk expressed in R, whether you followed your plan and your emotional state in one word. A chart screenshot at entry helps a lot during the review.
Is an Excel trading journal enough?
Yes to start with, as long as you fill it in after every trade and review it every month. Its weakness is manual data entry: many traders give up after a few weeks. A tool that imports your MT4, MT5, cTrader or TradingView history removes that step.
How often should you review your trading journal?
A quick pass at the end of each session to fill in missing fields, then a proper review once a month. The monthly review compares your results by setup, by time of day and by whether you followed your plan, over enough trades to be meaningful.
How many trades do you need before drawing conclusions from your journal?
There is no universal threshold, but below 20 to 30 trades per category, differences in results can simply be chance. Collect several weeks of data before dropping a setup or changing a rule.
What is the difference between a trading journal and my broker's history?
Your broker's history records what happened: prices, size, result. The journal adds why you took the trade and what state you were in. That context is what lets you tell a normal loss apart from a discipline mistake.
Sources
04- Harkin et al., Does monitoring goal progress promote goal attainment? A meta-analysis of the experimental evidence, Psychological Bulletin (2016)
- ESMA, ESMA agrees to prohibit binary options and restrict CFDs to protect retail investors (2018)
- Barber, Lee, Liu and Odean, The cross-section of speculator skill: evidence from day trading, Journal of Financial Markets (2014)
- AMF (French financial markets authority), Study of retail investors' results trading CFDs and Forex in France (2014)
Educational content. It does not constitute investment advice. Trading leveraged products carries a high risk of losing your capital.