In short
Retail traders mostly lose for four reasons measured by regulators: average losses bigger than average wins, fees multiplied by the number of trades, positions too large for their capital, and experience that fixes nothing without measurement. Depending on the study, 68% to nearly 90% of retail clients lose money on leveraged products.
Key takeaways
- According to the AMF, France's financial markets authority, 89.4% of the 14,799 retail clients of Forex and CFD brokers it studied lost money over four years, with a median loss of €1,843.
- Losses do not come mainly from fees: the AMF puts them at 14.2% of client losses, excluding the spread. The rest comes from trading decisions.
- In SEBI's study of fiscal year 2025-2026, the average loss of losing traders was 21% larger than the average profit of winning traders.
- The more often and the bigger a client trades, the more they lose: in the AMF study, clients who placed at least 250 orders lost €18,741 on average.
- Experience alone does not make you profitable: the 1,881 clients active every year in the AMF study went from 82.5% to 87.6% losers over four years.
- To find your own cause, compare your gross and net results, your average win and average loss, and the size of your losing trades.
You learned technical analysis, you have a strategy, you set stops. And yet your account keeps shrinking. You are not an isolated case: it is the outcome for the vast majority of retail traders, measured by several regulators across hundreds of thousands of accounts. The good news is that these studies do not only say how many traders lose. They also answer the question every losing trader asks: why do traders lose money? With numbers.
This guide goes through those causes one by one, using the original reports from the AMF, ASIC and SEBI, then gives you a method to find out which one applies to you.
Why do most traders lose money?
Retail traders lose mainly for four measurable reasons: their average losses are bigger than their average wins, their fees grow with their number of trades, their positions are too large for their capital, and experience does not fix these mistakes on its own.
A losing trader, as regulators define it, is a trader whose net result, fees included, is negative over the period studied. Not a trader who had a bad week. A trader whose system, as actually executed, destroys capital.
These four causes have one thing in common: none of them is bad luck. They are mechanisms, and a mechanism can be measured in a trade history.
How many traders actually lose money?
Between 68% and 97% depending on the product, the country and the period observed. “90%” is not a single official statistic, but the regulators’ studies all land around that order of magnitude.
| Study | Population | Period | Share of losers |
|---|---|---|---|
| AMF (France, 2014) | 14,799 Forex and CFD clients | 4 years (2009-2013) | 89.4% |
| ESMA (Europe, 2018) | Retail CFD accounts | National regulators’ data | 74% to 89% |
| ASIC (Australia, 2026) | Retail clients of 52 CFD issuers | Fiscal 2023-2024 | 68% |
| SEBI (India, 2026) | Individual equity derivatives traders | Fiscal 2025-2026 | 87.7% |
| Chague et al. (Brazil, 2019) | Futures day traders with at least 300 trading days | Started between 2013 and 2015 | 97% |
Two details change how you read these numbers. First, the longer the period, the higher the rate: the AMF (France’s financial markets authority) measures about 84% losers in any given year, but 89.4% over four cumulative years. Second, the typical loss is not trivial: the median loss is €1,843 in the AMF study, and the average loss is €10,887, dragged down by a few very large losses.
And on the other side? In India, SEBI shows that proprietary traders made about 44,000 crore rupees in gross profits in fiscal 2025-2026, and that 99% of the profits of these traders and foreign investors came from entities using algorithmic orders. In that market, when a retail trader clicks, they are often trading against fast, well-capitalized machines.
Cause 1: losses bigger than wins
The first cause is arithmetic: most losing traders win often, but their average losses are bigger than their average wins. A good win rate is not enough to make up for it.
SEBI measures this directly: in fiscal 2025-2026, the average loss of losing traders reached 147,000 rupees, against an average profit of 122,000 rupees for winners, an average loss 21% larger.
The same pattern shows up trade by trade. Across 12 million trades analyzed by DailyFX in 2011, clients won 59% of their EUR/USD trades, but lost 127 pips on an average losing trade against 65 pips on an average winning trade. We break down this calculation and the break-even threshold in our guide to win rate.
Why this imbalance? Because people cut winners too early and hold losers too long. Terrance Odean measured it across 10,000 brokerage accounts (Journal of Finance, 1998): investors realized 14.8% of their paper gains, but only 9.8% of their paper losses. That is the disposition effect: cashing a gain feels good, cashing a loss hurts, so you put it off.
In your history, this bias leaves a simple trace: your average loss is larger than your planned stop, or your average win is much smaller than your target.
Cause 2: fees and the number of trades
Fees are not the main cause of losses, but they turn small edges into losses, and they grow with every trade. The more active a trader is, the more they lose.
The AMF estimates that the fees charged by brokers (commissions and financing costs) explain only 14.2% of client losses. That figure excludes the spread, which no broker disclosed, so the real cost is higher. Above all, the AMF finds that clients who placed at least 250 orders over four years, 52% of the population, lost €18,741 on average, against €10,887 for everyone.
The ASIC report published in January 2026 goes further:
- Retail clients’ net losses exceeded 458 million Australian dollars, including 73 million in fees.
- 5% of clients would have been profitable without fees, and ended up losing because of them.
- Among active traders (more than 50 positions opened per month on average), 19% of clients who were profitable before fees became losers after fees.
Fees work like a toll: they do not ruin you on one trade, they ruin you on a thousand. That is the mechanism behind overtrading, where every trade without an edge costs at least its spread and commission.
Cause 3: leverage and position size
The third cause is size: traders who take the biggest positions lose the most, and a handful of very large losses outweighs everything else.
In the AMF study, clients whose average order size exceeded €10,000 (leverage included), 62% of the population, lost €14,876 on average. And the distribution is heavily lopsided: 722 clients each lost more than €50,000, for a total of more than €102 million, about 63% of the €161 million lost by all clients. On the other side, only 121 clients made more than €24,000, for about €10 million in total.
SEBI finds the same in India: about 23% of traders account for nearly 90% of total losses. And ASIC shows that options CFDs, a product ASIC calls “double leveraged”, produces 85% losing clients, against 68% for CFDs as a whole.
That is exactly what pushed ESMA to cap retail leverage on CFDs in 2018: 30 to 1 on major currency pairs, 20 to 1 on other pairs, gold and major indices, 10 to 1 on other commodities, 5 to 1 on individual stocks and 2 to 1 on cryptocurrencies.
Leverage does not create the loss, it sets its size. A mistake at 0.5% risk is a lesson, the same mistake at 5% is a hole. To decide where to set that dial, read our guide on how much to risk per trade.
Cause 4: experience fixes nothing on its own
The fourth cause is the most counterintuitive: persistence does not make you profitable. Without measurement, experience repeats the same mistakes with more capital.
The AMF followed a fixed group of 1,881 clients who were active every year from 2009 to 2012:
| Cumulative period | Share of losers | Average result |
|---|---|---|
| 2009 only | 82.5% | −€4,989 |
| 2009 to 2010 | 85.5% | −€10,183 |
| 2009 to 2011 | 85.1% | −€16,386 |
| 2009 to 2012 | 87.6% | −€26,745 |
Four years of experience, and the share of losers went up. The AMF concludes there is no learning effect.
The Brazilian study by Chague, De-Losso and Giovannetti reaches the same conclusion for day traders who persisted at least 300 days: 97% lost money, and only 0.4% earned more than a bank teller’s salary (54 dollars a day). In Taiwan, Barber, Lee, Liu and Odean find that less than 1% of day traders manage to profit predictably, after fees, over time.
The market does not pay for hours spent in front of the screen. It pays for the mistakes you have measured and stopped repeating.
That is why a trading journal changes the game: it turns experience into data, and data into rules.
How to find out why you lose: a 5-step diagnosis
Statistics describe crowds. Your account has one dominant cause, and you can find it in an hour with your history exported from MetaTrader, cTrader or TradingView.
- Calculate your gross result. Add up commissions and swaps, then remove them from your net result. Positive gross and negative net: your problem is fees and volume. Negative gross: keep going.
- Divide your fees by your number of trades. Compare this average cost per trade with your average gross profit per trade. If the cost is larger, you are working for your broker.
- Compare your average win and your average loss. If your average loss is larger than your average win, calculate the win rate you would need to break even, and compare it with yours.
- Sort your trades by risk size. Isolate those whose risk exceeds twice your usual risk and add up their result. This is often where revenge trading hides.
- Look at your result quarter by quarter. If it has not improved in a year, you are not learning: you are repeating.
Here is what it looks like on a losing account (illustrative example): 300 trades over six months, €3 of fees per trade, net result of −€1,500.
| Block of trades | Count | Gross result | Fees | Net result |
|---|---|---|---|---|
| Normal size | 260 | +€400 | −€780 | −€380 |
| Risk above 2 times usual | 40 | −€1,000 | −€120 | −€1,120 |
| Total | 300 | −€600 | −€900 | −€1,500 |
Reading: the method is not a loser in itself, it makes €400 gross on normal-size trades. But it only brings in about €1.54 per trade before fees, for €3 of fees: volume makes it a loser. And 40 oversized trades, 13% of all trades, produce nearly three quarters of the net loss. Two causes, two rules: fewer trades, and a fixed risk size.
For each cause, here is the signal to look for:
| Cause | Measure in your history | Warning sign (benchmark) |
|---|---|---|
| Losses bigger than wins | Average loss ÷ average win | Ratio above 1 with a win rate below your break-even threshold |
| Fees and volume | Total fees ÷ positive gross result | Positive gross but negative net |
| Size and leverage | Result of trades with risk above 2 times usual | These trades make up more than half of your loss |
| No learning | Result per quarter | No improvement over 4 quarters |
What TradeIA measures for you
You can run this diagnosis by hand in a spreadsheet, but it takes time, especially when you need to cross trade size, trading hours and losing streaks.
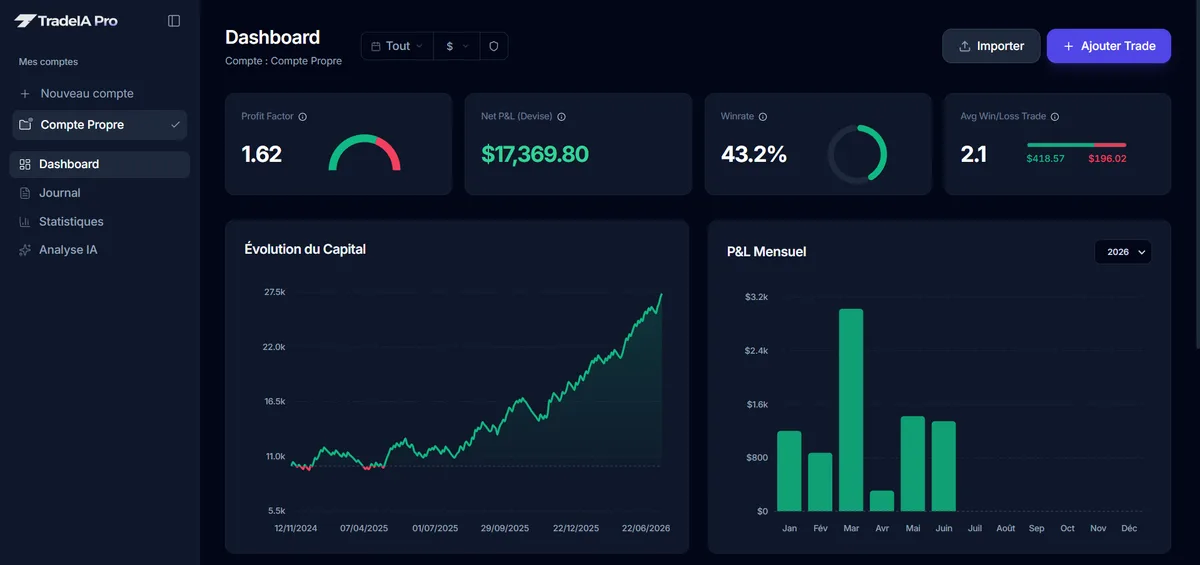
TradeIA imports your MT4, MT5, cTrader or TradingView history and runs these checks automatically. The analysis flags, among other things, streaks of at least three losses during which your position size increases by more than 50% from one trade to the next, an average loss above 1.5 times your average real risk (a sign that your stops are not respected), a risk size that varies too much from trade to trade, and the symbols where you keep losing.
Whatever the tool, the goal is the same: to go from “I’m losing” to “I’m losing because of this”. Regulators found four causes across hundreds of thousands of traders. Your history will tell you which one is yours.
Frequently asked questions
05Is it true that 90% of traders lose money?
It is an order of magnitude, not a single official statistic. The AMF measured 89.4% losing clients over four years in France, ESMA cites 74% to 89% of losing CFD accounts in Europe, ASIC 68% in Australia in 2023-2024 and SEBI 87.7% on equity derivatives in India in 2025-2026. The exact figure depends on the product, the country and the period.
Can you make money trading?
Yes, a minority does, but it is small and hard to identify in advance. ASIC counts 29% of CFD clients in profit over one year, but over longer periods the numbers drop: Barber, Lee, Liu and Odean find that less than 1% of Taiwanese day traders profit predictably after fees.
Do experienced traders lose less?
Not automatically. In the AMF study, clients who stayed active four years in a row had a 87.6% loser rate, almost the same as the whole population (89.4%), and their cumulative average loss grew from €4,989 to €26,745. Experience only helps if you measure and fix your mistakes.
Who makes the money retail traders lose?
Part of it goes to fees (commissions, spread, financing), the rest goes to the counterparties. In India, SEBI shows that proprietary traders made about 44,000 crore rupees in gross profits in fiscal 2025-2026, and that 99% of the profits of these traders and foreign investors came from entities using algorithms.
How do I know if fees are making me lose?
Add up your commissions and swaps, then calculate your gross result by removing them from your net result. If your gross is positive and your net is negative, your method has a small edge that fees eat up: trade less or aim for wider moves. If your gross is already negative, the problem is elsewhere.
Sources
07- AMF, Study of retail investors' results on CFD and Forex trading in France (2014)
- ASIC, Report 828: Risky business, driving change in CFD issuers' distribution practices (2026)
- SEBI, Profitability of Individual Traders in the Equity Derivatives Segment (FY25-FY26) (2026)
- ESMA, ESMA agrees to prohibit binary options and restrict CFDs to protect retail investors (2018)
- Chague F., De-Losso R. and Giovannetti B., Day trading for a living?, University of São Paulo (2019)
- Barber, Lee, Liu and Odean, The cross-section of speculator skill: evidence from day trading, Journal of Financial Markets (2014)
- Odean T., Are Investors Reluctant to Realize Their Losses?, The Journal of Finance (1998)
Educational content. It does not constitute investment advice. Trading leveraged products carries a high risk of losing your capital.